Technology

Technology

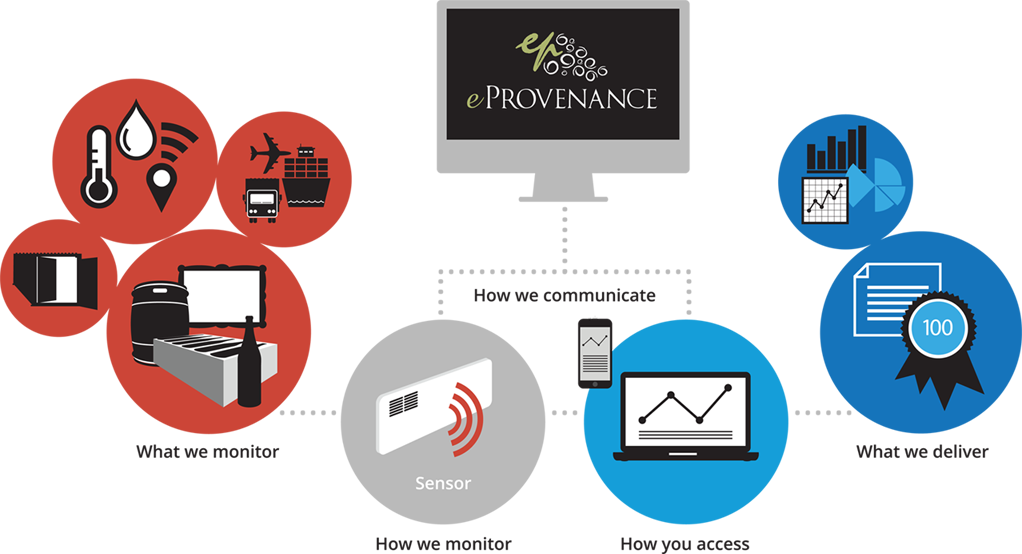
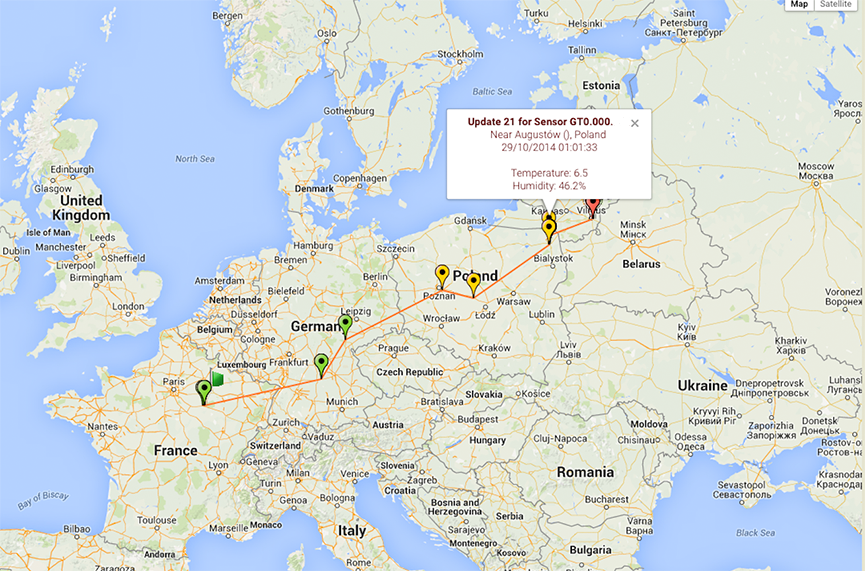
We offer a range of solutions using our high-tech sensors to monitor temperature, humidity and geolocation. As a known, independent and respected resource in the world of fine wine, we can certify the provenance of our clients' wines in storage and transport. We also determine the eProvenance Score, which clearly indicates whether the wine has been damaged, not just whether shipment temperatures have been problematic. The same trusted technology can also be used to monitor fine art and other fine goods and our data are accepted as the basis for insurance claims.

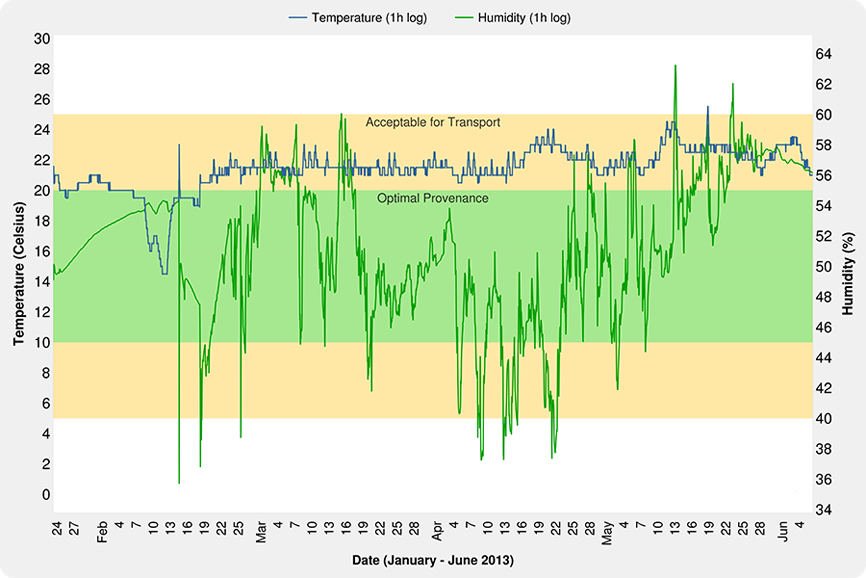
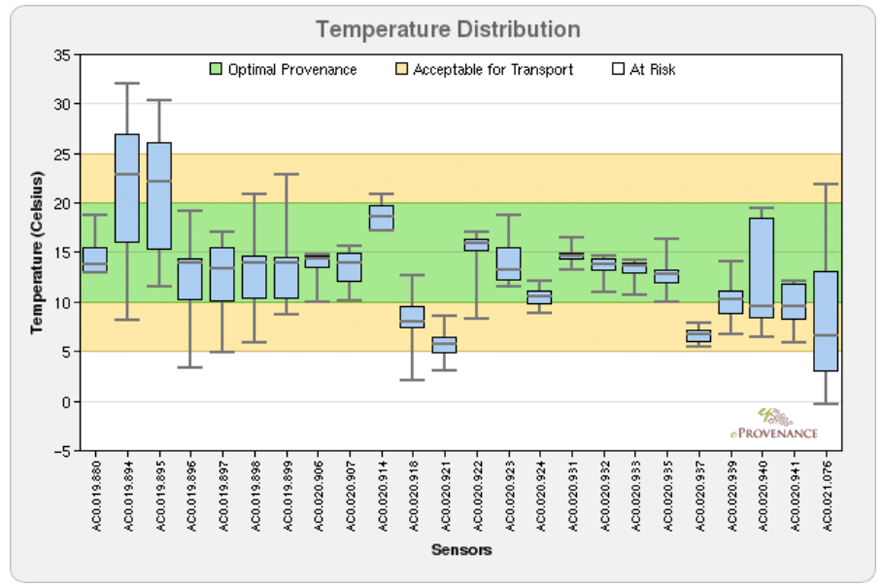
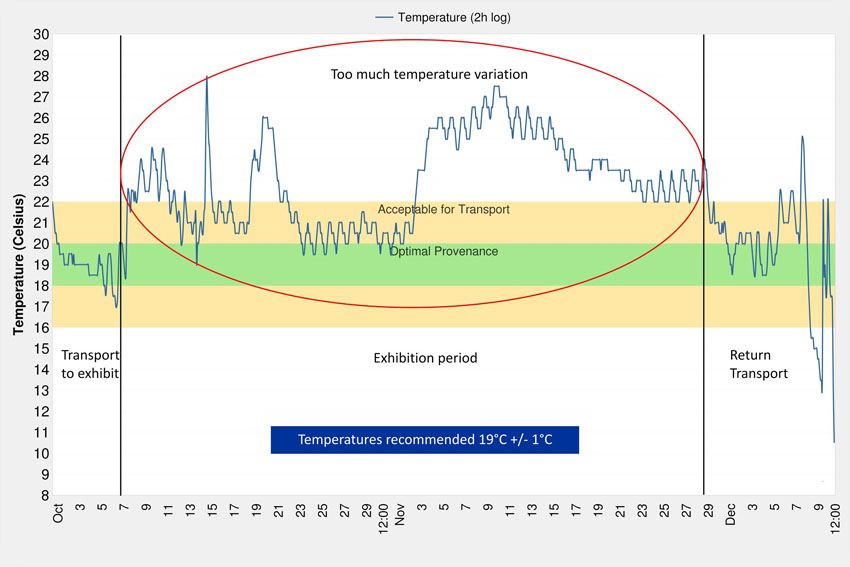
Information collected by our sensors comes back into our Online Monitoring System (OMS), a sophisticated database and analytic tool. The OMS delivers in-depth analysis through interactive graphs, statistical summaries and comparative views, which help you assess the quality of your shipments and determine future strategies.

Technology

With easy access to this information through a secure, dedicated dashboard on our OMS, you gain a full understanding of shipment conditions and you will be able to take valuable actions regarding quality control and marketing. For example, you can:

  • Identify and correct any flaws in your cold chain or shipping methods
  • Verify provenance of shipments
  • Protect precious goods
  • Leverage temperature monitoring to differentiate your product through PR and marketing promotions
  • Enhance customer loyalty by delivering excellent provenance
  • Increase incremental sales from satisfied customers

eProvenance Online Monitoring System

Choose from a variety of graphs and statistical summaries to display the quality of your shipments.

Graph The OMS allows you to mouse over any line on the graph to see detailed data and zoom in on a selected timespan.
Map The eProvenance Global Tracker collects data on the shipment journey and conditions. The OMS displays the temperature, humidity and geolocation information on an interactive map where you can view the full journey or zoom in on particular areas of interest.
Temperature Icon
Graph This graph represents the distribution of the data points of each sensor.
Graph Temperature minimum, maximum, median and quartiles per sensor.
Graph eProvenance sensor attached to the back of a work of art during the shipment and exhibition.

To learn more, please contact eProvenance.